1Energy and Wetlands Research Group, Centre for Ecological Sciences [CES],
Indian Institute of Science, Bangalore – 560012, India.
2 Centre for Sustainable Technologies [CST], Indian Institute of Science.
3Centre for Infrastructure, Sustainable Transport and Urban Planning [CiSTUP],
Indian Institute of Science, Bangalore 560 012.
*Corresponding author:
trv@iisc.ac.in
Introduction
Energy constitutes a fundamental and strategic tool to attain the minimum quality of life and energy consumption
patterns are closely linked to the agro-climatic conditions and socio-economic factors (Ramachandra et al., 2000).
Exploitation and conversion of natural resources through various energy conversion devices for heating, lighting to
energy intensive commercial steel production have made significant improvement in lifestyles. However, over
exploitation of natural resources especially perishing fossil fuels for meeting the ever increasing energy demands
has affected the environment and health. Consumption of fossil fuels is the prime reasons for enhanced greenhouse
gases (GHG) in the atmosphere trapping heat and light in the earth's atmosphere, resulting in the global warming.
The problem of energy use and GHG emission is particularly acute in cities, as urban areas support 50% of the world
population (WBG, 2010) and are responsible for 67% of the world's energy demand. By 2030, 73% of the world energy
use will be in cities (WEO, 2008). In terms of the global total anthropogenic GHG emission, cities contribute
roughly 75- 80%. Within cities, the domestic sector is the major energy consumer (Pachauri, 2004). Urban
households in India, for example, are responsible for about 45% of total primary energy use nationwide, and a large
share of which is through non-commercial fuels such as fuel wood, dung, etc. The residential energy consumption is
shooting up with the changes in lifestyle consequent to the rapid urbanization in many towns and cities in India
(Ramachandra et al., 2017). This has necessitated studies on carbon emissions due to energy consumption in the
residential sector, Bangalore, India.
The household sector is one of the largest users of energy with about 30% of final energy consumption (excluding
energy used for transport) in India (CMIE, 2006). The annual electricity sale to domestic sector is 6.20 billion kWh
which accounts to 16.5% of the total electricity in Karnataka (BEE). Energy consumption due to different household
activities plays a major role in determining the pattern and magnitude of domestic energy use, which also depends on
family size, climate, appliance ownership, lifestyle, physical characteristics of a house and also human's energy
behaviour. In order to devise strategies to reduce the energy consumption, sustainable lifestyles in an equitable
and efficient fashion, requires an understanding of the empirical links between lifestyles and the associated energy
consumption and carbon emissions or carbon footprint.
This helps to minimise the GHG emissions and the resultant destabilisation of the Earth's biosphere.
Bangalore has been experiencing rapid unplanned urbanisation since 1990 resulting in the clumped growth with intense
economic activities at some pockets and dispersed (sprawl) growth at outskirts. Data analyses reveal that some wards
have higher energy consumption and CO2 emission than others, but an understanding of the spatial patterns is yet to
be acquired. Thus, the objective of the current research is to assess the effect of socioeconomic factors such as
household size, income level on the energy consumption and emission. The study has been carried out for a rapidly
urbanizing region in India. Greater Bangalore is the administrative, cultural, commercial, industrial,
and knowledge capital of the state of Karnataka, India with an area of 741 sq. km. and lies between
12o39'00'' to 13o13'00'' N and 77o22'00'' to 77o52'00'' E (Figure 1).
Bangalore city administrative jurisdiction was redefined in the year 2006 by merging the existing area of Bangalore
city spatial limits with 8 neighboring Urban Local Bodies (ULBs) and 111 Villages of Bangalore Urban District.
Bangalore has grown spatially more than ten times since 1949 (~69 square kilometers to 741 square
kilometers) and is the fifth largest metropolis in India currently with a population of about 8.5
million (Sudhira et al., 2007; Ramachandra and Kumar 2008). Bangalore city population has increased enormously from
65,37,124 (in 2001) to 95,88,910 (in 2011), accounting for 46.68 % growth in a decade. Population density has
increased from 10,732 (in 2001) to 13392 (in 2011) persons per sq. km (Ramachandra et al., 2011a; Ramachandra et
al., 2012). The per capita GDP of Bangalore is about $2066, which is considerably low with limited expansion to
balance both environmental and economic needs
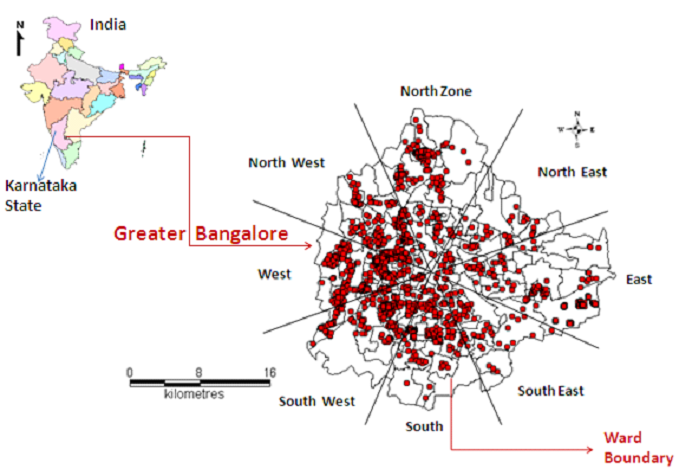
Figure 1: Study Area - Bangalore city, Karnataka,
India